Email Reputation Benchmarks for Cold Email: What Good Looks Like by Industry
Learn email reputation benchmarks for cold email by industry, including sender score, inbox placement, complaint rate, reply rate, bounce rate, and monitoring actions.
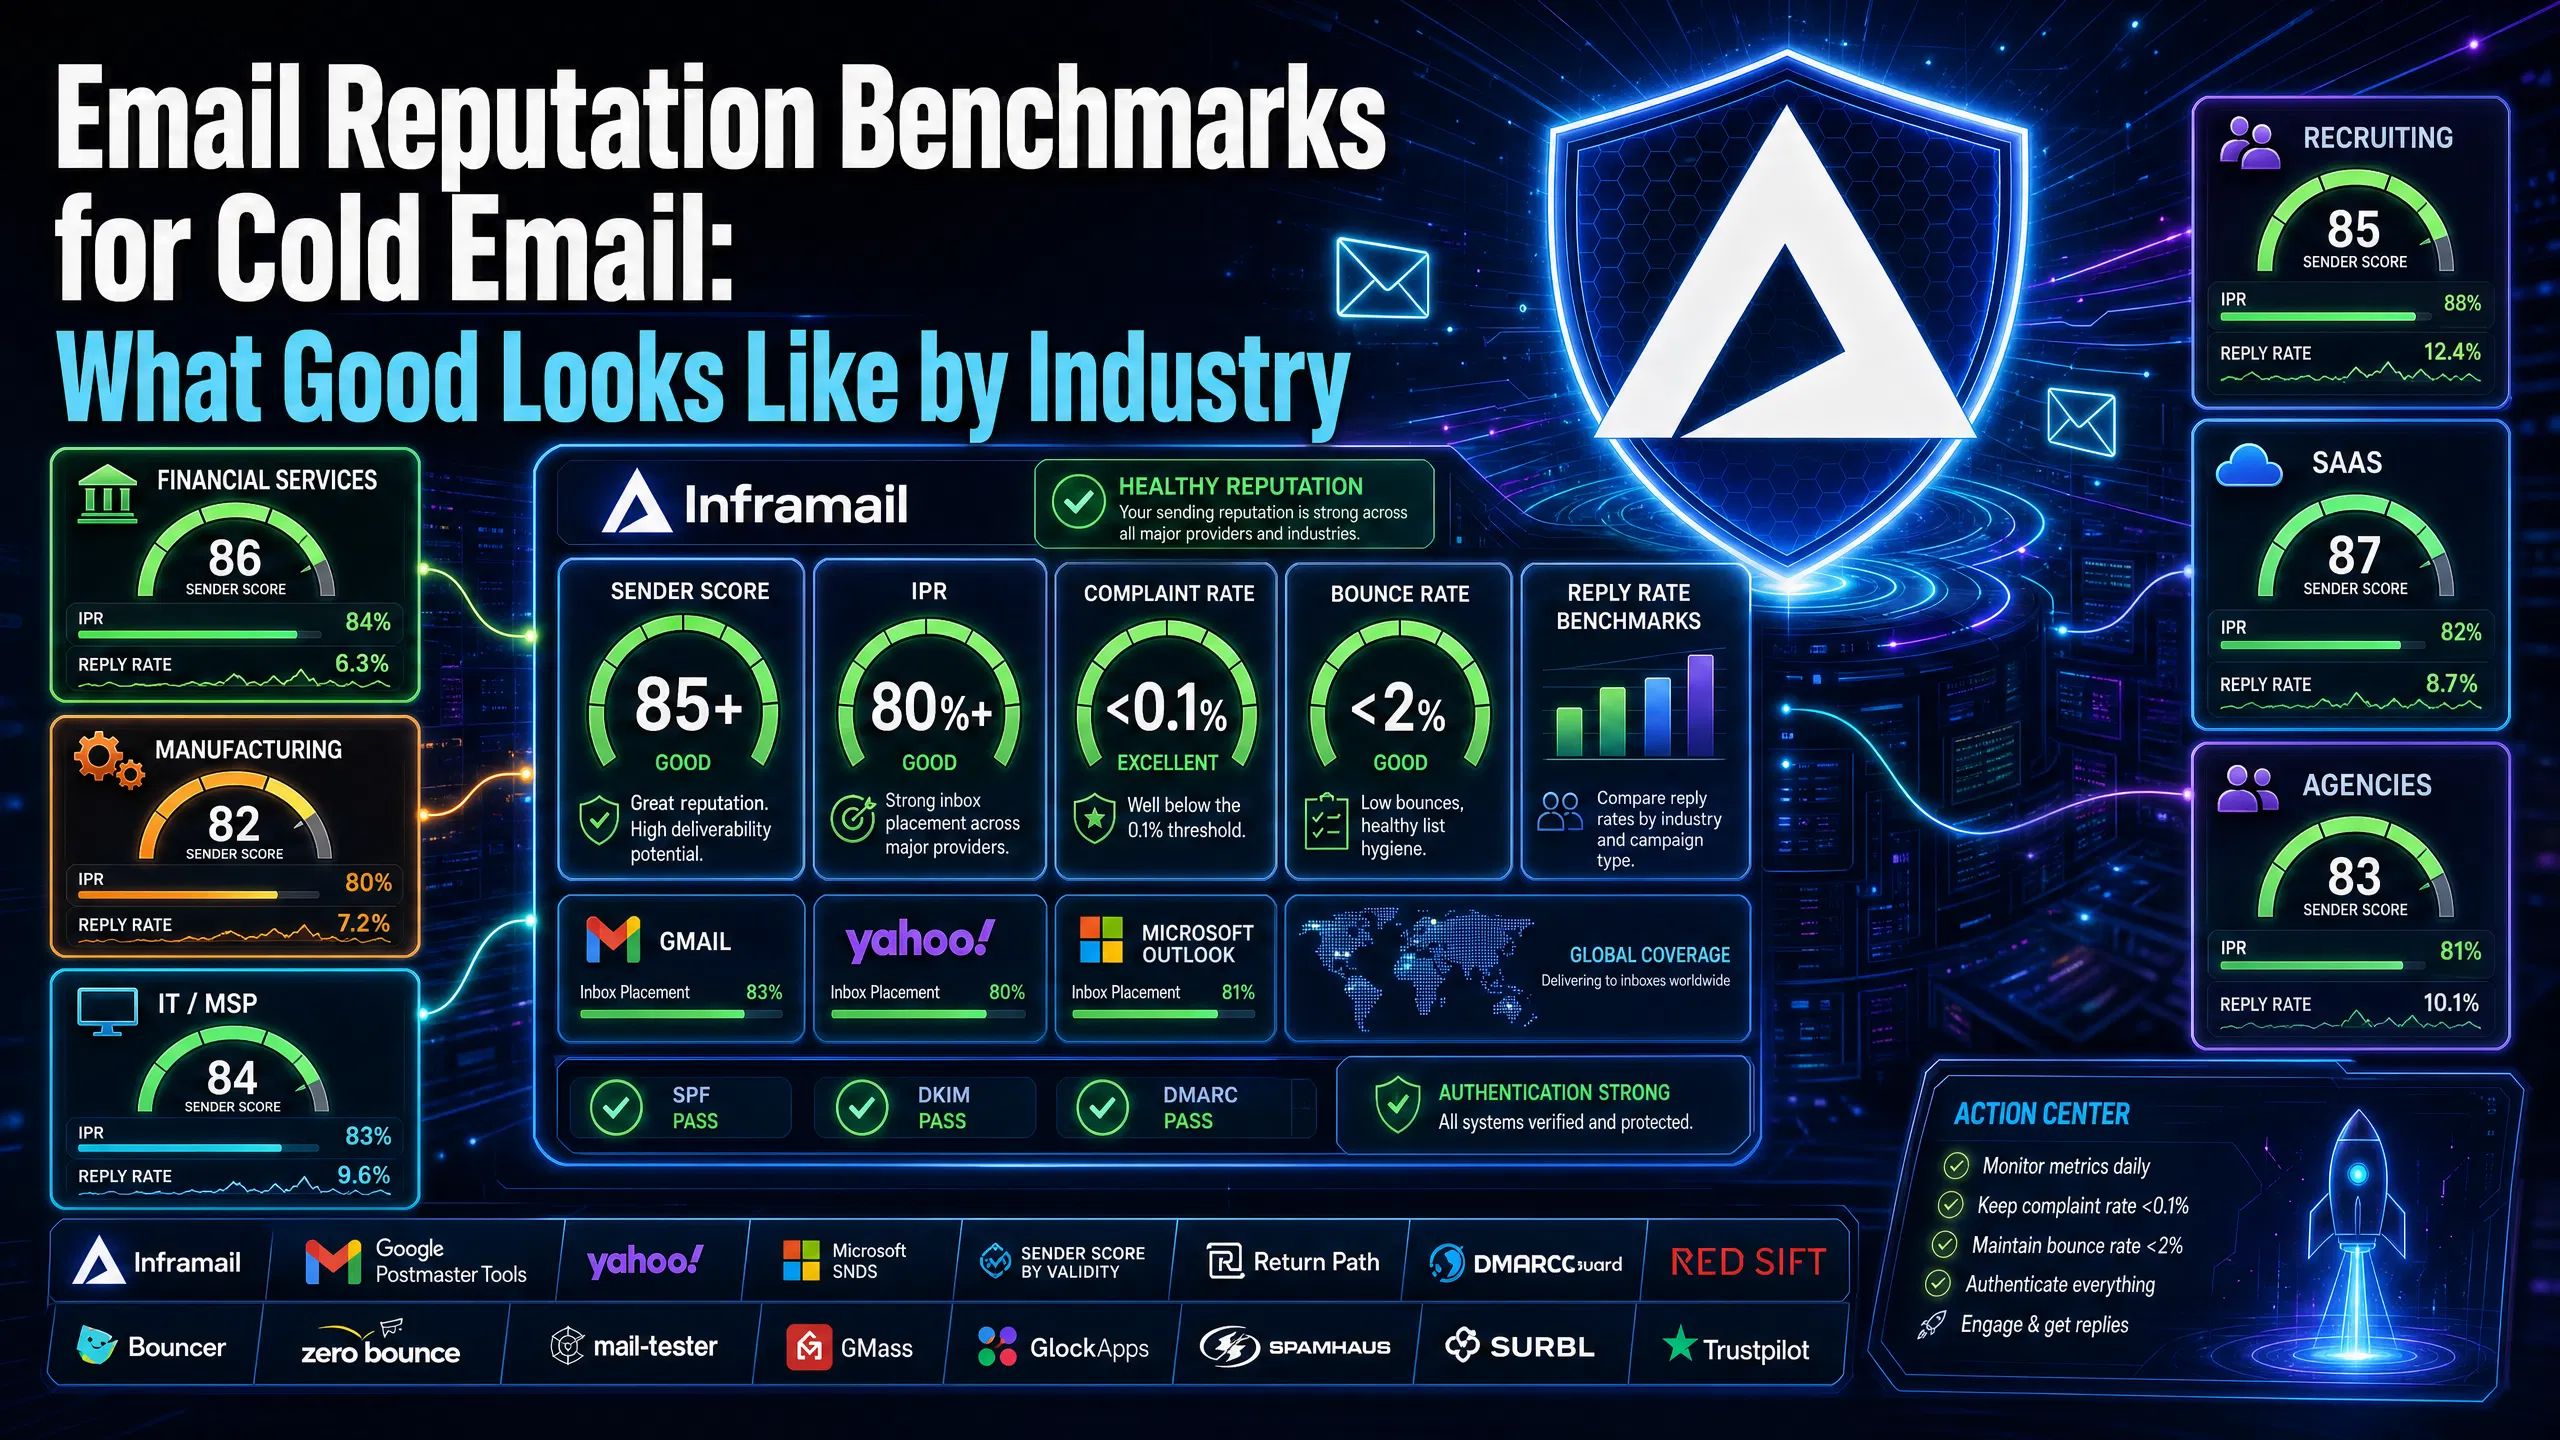
TL;DR: A healthy sender score sits at 85 or above for sustained high-volume cold outreach, with scores below 70 typically causing deliverability problems. Target an inbox placement rate (IPR) above the industry average, with strong campaigns often reaching higher placement. Keep complaint rates low across all verticals, as Gmail and Yahoo reportedly enforce strict thresholds. Reply rate benchmarks vary significantly by vertical, with recruiting typically performing better than other sectors. Gmail, Yahoo, and Microsoft require SPF, DKIM, and DMARC authentication for bulk senders.
Your cold email metrics mean nothing without a frame of reference. A 3% reply rate might signal a campaign in crisis for a recruiting firm running warm audiences, or it might represent solid performance for an enterprise SaaS team targeting C-suite buyers with six-month buying cycles. Complaint rates that look acceptable at small send volumes become dangerous at scale. Without clear benchmarks by vertical, you're guessing whether to optimize copy, fix infrastructure, or both.
This guide establishes the specific numbers that define healthy sender reputation across the metrics that matter most: sender score, inbox placement rate, complaint rate, and reply rate. It also covers how to monitor each metric and what to do when you fall short.
Before applying benchmarks, you need to understand what each metric captures and how it differs from similar-sounding figures.
Sender score
Sender Score is a reputation rating from 0 to 100 that reportedly uses a rolling 30-day window. The score compares your sending behavior against all other tracked IPs and reflects spam complaints, bounce rates, spam trap hits, blocklist presence, and sending volume consistency.
The practical threshold: a score of 90-100 puts you in the top deliverability tier with inbox placement consistently above 90%. According to Return Path's benchmark data, a score drop from 83 to 70 reduces delivery rates by roughly 20%. Below 70, your emails typically face increased risk of landing in spam or getting blocked.
Inbox placement rate
Inbox placement rate (IPR) measures the percentage of delivered emails that reach the primary inbox, not spam, not promotions, not any other filtered folder. The formula is:
(Emails in Inbox / Total Emails Delivered) x 100 = IPR
This differs from deliverability rate, which only measures whether an email reached the server without bouncing. An email that gets "delivered" can still land in spam. Industry placement tiers break down as follows: 80-100% is considered excellent, while 60-80% signals a campaign that needs improvement. For cold email campaigns, target the 80%+ range as your performance floor.
Complaint rate
Complaint rate measures how many recipients marked your email as spam as a percentage of delivered emails. The standard calculation: (complaints / delivered emails) x 100. For example, if you send 10,000 emails and 8 people mark them as spam, your complaint rate would be approximately 0.08%.
Google reportedly requires senders to stay below 0.3% but recommends under 0.1%. Yahoo enforces similar thresholds. Exceeding these limits triggers throttling, spam foldering, or outright blocking. For cold email, treat 0.1% as your hard ceiling, not a warning zone.
Reply rate
Reply rate measures responses as a percentage of delivered emails: (unique replies / delivered emails) x 100. Only count replies that show intent. Out-of-office messages and delivery confirmations don't qualify. For accurate measurement, wait 7 to 10 days before calculating a final reply rate per sequence, since a meaningful portion of replies arrive after the first 48 hours.
Every industry benchmark builds on a set of universal floors. If you're below these numbers, your vertical comparison doesn't matter yet.
The four non-negotiable floors
Metric | Minimum floor | Target |
|---|---|---|
Sender Score | ~70 | 85+ |
Inbox Placement Rate | Industry baseline | Strong performance |
Complaint Rate | Below 0.3% | Below 0.1% |
Bounce Rate | Below 5% | Below 2% |
Strong programs typically trend below 2% bounce rate. If you're above that, your list needs cleaning before any other optimization. Tools like Bouncer or ZeroBounce remove invalid addresses before they generate hard bounces that damage your score.
Authentication as a mandatory baseline
Authentication adoption across the industry remains low. DMARCguard research shows only 56.0% of senders have SPF configured and DKIM adoption lags at 22.7%, largely due to configuration complexity, and just 14.9% of domains have implemented a DMARC policy of any level, according to Red Sift's analysis of 73.3 million domains. Since Google and Yahoo began enforcing authentication requirements in 2024 and Microsoft introduced high-volume sender requirements in 2025, this is no longer optional for bulk senders. Failed authentication doesn't just reduce inbox placement. It flags your domain as unverified and accelerates reputation decay.
The SPF, DKIM, DMARC setup guide covers the full DNS configuration process. Automation significantly reduces the time investment compared to manual configuration across multiple domains.
The sections below break down reply rate, sender score, inbox placement rate, and complaint rate targets for each major vertical covered in this guide.
Recruiting and staffing
Recruiting leads all verticals in reply rate performance. Companies are either actively hiring or preparing to hire, which creates stronger context match than most cold outreach. Timing matters more here than in any other vertical: hitting companies during active hiring windows gets you to the top of the range.
Reply rate benchmark: Typically 5-8% average, with well-timed campaigns reaching 10%+
Sender score target: 80+
IPR target: 80%+
Complaint rate ceiling: 0.1%
If your recruiting campaigns fall below 4%, the problem is usually targeting stale job data rather than a deliverability issue.
SaaS / Software
SaaS campaigns face significant inbox saturation. Decision-makers at software companies receive high volumes of cold outreach, which compresses reply rates and raises the bar for relevance and specificity. The SaaS cold email playbook confirms that lower reply rates in this vertical often signal list quality issues rather than deliverability problems. Before blaming infrastructure, audit your targeting.
Reply rate benchmark: Typically 3-5% average, with strong campaigns reaching higher
Sender score target: 85+
IPR target: 83%+
Complaint rate ceiling: 0.1%
B2B agencies and marketing services
Agency-to-agency cold email carries mixed reception. Marketing professionals recognize outreach tactics and apply higher skepticism. Short, specific copy with a clear service-relevance signal outperforms generic approaches in this vertical.
Reply rate benchmark: Typically 3-6% average
Sender score target: 85+
IPR target: 80%+
Complaint rate ceiling: 0.1%
Strong campaigns in this vertical can exceed the 6% threshold when targeting is tight and messaging is specific.
Financial services
Financial services compliance requirements create a smaller addressable audience and a more cautious buyer. Cold email volumes tend to be lower and more targeted, which can protect complaint rates, but the buying cycle is long and reply rates reflect that.
Reply rate benchmark: 2-4% average
Sender score target: 88+ (financial services recipients often use filtered corporate inboxes that apply stricter rules)
IPR target: 80%+
Complaint rate ceiling: 0.1%
The higher sender score target matters here because financial services companies frequently run Microsoft 365 with additional filtering layers. Dedicated IPs reduce the risk of shared pool contamination from senders operating in adjacent categories.
Manufacturing and IT/MSP
Both verticals involve decision-makers who respond well to operational specificity. Vague value propositions get deleted. Specific pain points tied to their industry, such as supply chain issues, managed services contracts, or uptime requirements, lift reply rates meaningfully.
Reply rate benchmark: 2-4% for manufacturing, 3-5% for IT/MSP
Sender score target: 80+
IPR target: 78%+
Complaint rate ceiling: 0.1%
The visual below shows where each vertical clusters across these performance tiers, giving you a fast comparison for client reporting and target-setting conversations.
2026 baseline across all industries
The latest aggregate data provides three performance tiers to measure against:
Elite campaigns (top performers across all verticals): often above 10% reply rate
Top quartile: approximately 5.5% reply rate
Average: around 3-4% reply rate
If you're consistently below the average range, the gap is often a combination of list quality, copy relevance, and sending volume per inbox. The 2026 cold email deliverability guide covers the specific technical and structural changes that affect placement this year, including the infrastructure decisions that protect sender score during scale-up.
Monitoring needs to happen on a consistent schedule. Run monthly seed testing and weekly Postmaster Tools reviews at minimum for any active campaign, and audit authentication quarterly to catch DNS changes that silently break deliverability.
Google Postmaster Tools
Google Postmaster Tools is a dashboard showing how Gmail sees your sending domain and IPs. It reports domain reputation, IP reputation, spam rate, authentication pass rates (SPF/DKIM/DMARC), delivery errors, and encryption percentage. To set it up, add a TXT record to your domain's DNS for ownership verification.
One practical constraint: Google requires consistent daily volume to Gmail recipients before showing data. Reports suggest a threshold of roughly 100-200 messages per day to Gmail addresses. Below that, dashboards show "insufficient data." If you're below that volume, use Mail-Tester for individual domain checks instead.
Domain reputation is the leading indicator in Postmaster Tools. It moves before spam rate does and shows you where the trend is heading before it becomes a crisis.
Microsoft SNDS
Microsoft's Smart Network Data Services (SNDS) provides data about how email traffic is received by Outlook.com and other Microsoft consumer email services. It helps senders identify IP reputation issues that could lead to emails being blocked or delivered to the junk folder. For agencies running Microsoft-based infrastructure, SNDS monitoring should run alongside Postmaster Tools, not instead of it. The infrastructure monitoring guide covers the full monitoring setup for agencies managing multiple client domains, including blacklist check schedules and alert thresholds.
Sender Score by Validity
Sender Score calculates your reputation based on a rolling 30-day average and attributes a score from 0 to 100. Check it regularly for active sending domains and immediately after any blacklist incident.
Set up automated alerts to catch reputation degradation before it becomes a crisis. Monitor these thresholds:
Spam rate above 0.1% in Gmail Postmaster Tools
Domain reputation dropping from "High" to "Medium" in Postmaster Tools
Bounce rates crossing 2%
Any blacklist listing in Spamhaus or SURBL
"Outstanding deliverability backed by personable, professional support. 1 on 1 with co-founder was extremely helpful to learning more about deliverability and proper infrastructure set up. Definitely satisfied, and look forward to working with this company long-term!" - Verified user review of Inframail
The sections below cover specific actions for each metric, ordered by the metric they affect.
Improving sender score
Verify your list: Use Bouncer or ZeroBounce to remove invalid addresses before each campaign. Hard bounces from bad addresses damage your score faster than almost any other single factor.
Avoid purchased lists: Purchased lists contain spam traps. Even a small number of spam trap hits causes significant score damage.
Authenticate properly: SPF, DKIM, and DMARC must all be aligned and passing. Check authentication status in Google Postmaster Tools after any DNS change.
Send consistently: Sudden volume spikes hurt reputation. Ramp gradually, with incremental volume increases per week, to maintain score stability during scale-up.
The cold email deliverability guide covers the exact technical infrastructure checklist for maintaining sender score across high-volume campaigns.
Reducing complaint rate
The five actions that cut complaint rates fastest:
Only email verified contacts from legitimate data sources. Purchased lists guarantee high complaints.
Make unsubscribing easy. The List-Unsubscribe header reduces spam button clicks because recipients choose unsubscribe over the spam button.
Segment by engagement. Stop emailing contacts who haven't engaged with recent sends. Disengaged recipients generate complaint rates well above your active audience.
Set clear expectations. When someone enters your sequence, the messaging should make the relevance immediately clear.
Monitor at the inbox level. One inbox with a high complaint rate can contaminate your domain reputation. The spam metrics monitoring guide covers per-inbox tracking.
Improving inbox placement rate
Segmentation drives IPR improvement more than any technical fix. Instead of sending a product update to 50,000 contacts, send it to the 10,000 active contacts who match the specific use case. A targeted send generates positive engagement signals, including opens, clicks, and replies, that mailbox providers treat as trust indicators.
For cold email specifically:
Run seed-based placement testing before scaling any sequence past 50 sends per day per inbox
Check IPR by inbox provider separately, since Gmail placement and Outlook placement often differ by 8-15 percentage points on the same domain
Warm new inboxes to full volume before assigning them to client campaigns, following the inbox warmup schedule that protects reputation during ramp-up
Improving reply rate
The three tactical changes with the highest impact on reply rate:
Build micro-segmented lead lists. Group prospects by shared trigger (recent funding, hiring signal, product launch) rather than broad industry category.
Keep first-touch emails short with a single CTA. Longer emails consistently underperform shorter, focused messages at cold email scale.
A/B test subject lines and openers. Run tests across a meaningful sample size before making decisions on copy direction.
Sender reputation starts with infrastructure decisions made before you send the first email. Dedicated IPs mean your sending reputation stays isolated from other users' behavior. Shared IP pools expose your metrics to contamination: one sender on the same pool with poor list hygiene can drive complaint rates and blacklist flags that affect every sender on the range.
Our Unlimited Plan includes 1 dedicated US-based IP. Our Agency Pack includes 3 dedicated US-based IPs. Both plans include automated SPF/DKIM/DMARC configuration, which eliminates the authentication gaps that affect a significant portion of senders industry-wide. Our blacklist monitoring dashboard auto-submits delisting requests when domains are flagged.
The dedicated vs shared IP guide covers exactly why IP type affects sender score and what the practical deliverability difference looks like across Gmail and Outlook at scale.
"For years, I considered running cold email campaigns but consistently held back due to a lack of technical knowledge and confidence... I am now successfully sending thousands of cold emails per day while generating high-quality leads. The results have exceeded my expectations." - Verified user review of Inframail
We score 9.5/10 on Mail-Tester and 88% inbox rate via GMass testing. For agencies managing multiple domains, our pricing plans provide dedicated infrastructure without per-domain cost scaling. Sign up to Inframail and get started today.
What sender score do I need before starting a cold email campaign?
Target a sender score of 70 or above before running any significant cold email campaign, and 85 or above for sustained high-volume outreach. Below 70, your emails face active spam filtering and blocking from major providers.
How do I check my inbox placement rate before scaling a campaign?
Use Google Postmaster Tools for Gmail placement data (requires 100-200+ daily sends to Gmail addresses) and seed-based tools like GMass or GlockApps across Gmail, Outlook, and Yahoo before scaling past 50 sends per day per inbox.
What is a good reply rate for cold email in B2B SaaS?
A 3-5% reply rate is typical for B2B SaaS cold email, with strong campaigns reaching higher. Consistently falling below the average range typically signals list quality or copy problems rather than deliverability issues.
How often should I check my sender reputation metrics?
Review Google Postmaster Tools weekly, run seed-based inbox placement tests monthly, and complete a full authentication audit quarterly. Check Sender Score immediately after any blacklist incident or campaign pause.
What complaint rate triggers Gmail filtering?
Gmail enforces a hard limit at 0.3%, but throttling and spam foldering begin at lower rates. Keep complaint rate below 0.1% to maintain healthy inbox placement across all major providers.
Does using a dedicated IP improve my sender score?
A dedicated IP isolates your reputation from other senders. On shared IP pools, one bad actor generates complaint rates and blacklist flags that affect every sender on the range. Dedicated IPs mean your sending behavior alone determines your score trajectory. Our Unlimited Plan includes 1 dedicated US IP, and our Agency Pack includes 3.
Why do inbox placement rates differ between Gmail and Outlook for the same domain?
Gmail and Outlook use different filtering algorithms, reputation signals, and spam threshold models. A domain with strong Postmaster Tools reputation data can still underperform on Outlook if Microsoft SNDS shows IP-level concerns. Monitor both platforms separately and investigate gaps above 10 percentage points.
Sender Score: A 0-100 reputation rating from Validity, calculated on a 30-day rolling window, reflecting complaint rate, bounce rate, spam trap hits, blocklist presence, and volume consistency.
Inbox Placement Rate (IPR): The percentage of delivered emails that reach the primary inbox rather than spam or promotions folders. Calculated as (emails in inbox / total emails delivered) x 100.
Complaint Rate: The percentage of delivered emails that recipients marked as spam, calculated as (complaints / delivered emails) x 100. Gmail's recommended ceiling is 0.1% with a hard limit at 0.3%.
Feedback Loop (FBL): An inter-organizational system where mailbox providers forward spam complaints from their users back to the sender, allowing senders to identify and remove complainers from future sends.
Dedicated IP: A sending IP address assigned exclusively to one sender, isolating their reputation from other users' behavior. Shared IP pools spread reputation risk across all senders on the range.
SPF/DKIM/DMARC: The three email authentication protocols required by Gmail, Yahoo, and Microsoft for bulk senders. SPF authorizes sending servers, DKIM signs messages cryptographically, and DMARC sets policy for handling authentication failures.
Spam Trap: An email address used by blacklist operators to identify senders using purchased or improperly maintained lists. Hitting spam traps causes immediate sender score damage and potential blacklisting.
Google Postmaster Tools: A free Google dashboard showing domain reputation, IP reputation, spam rate, and authentication pass rates for emails sent to Gmail addresses. You must verify domain ownership and maintain consistent daily volume to display data.